Basic usage
The purpose of anvil is twofold, it can be used as a python
library for implementing your own normalising flow models, or can be used
as a commandline application which allows you to train and sample models
for various sizes of 2-D scalar lattice field theories with \(\phi^4\)
interactions.
Running anvil
We provide a pair of complementary reportengine
applications: anvil-train and anvil-sample. The idea of these
commandline applications is to allow the user to train and sample from models
using the declarative programming framework that reportengine provides. Some
more information on reportengine can be found
here.
For the basic user who simply
wishes to reproduce our results we recommend using the template runcards
found in examples/runcards. In order to train a basic model on a 2-D
lattice, size \(6 \times 6\), on a scalar field theory with \(\phi^4\)
interaction, take the train.yml runcard from examples/runcards. Then
after performing a Conda installation, simply run (whilst in the same
directory as train.yml):
$ anvil-train train.yml
You should see the following output which indicates the model is training, it should also indicate an estimated training time:
[INFO]: All requirements processed and checked successfully. Executing actions.
[INFO]: Model has 83918 trainable parameters.
Checkpoint saved at epoch 0
loss: -6.502186298370361:  38%|█████▎        | 765/2000 [00:55<01:24, 14.54it/s]
The output of the training (saved models) will be found, by default, in a directory
with the same name as the stem of the runcard, in this case train. You can
change the name of your model to be something more sensible either by
changing the name of the runcard or using the --output commandline
flag. For more information on options when running anvil-train, run:
$ anvil-train --help
Each new model requires its own, uniquely named, output directory, however existing models can be trained further instead by giving an existing fit output directory as input as well as telling the fit which epoch to start the retrain from
anvil-train <existing output name> -r 1000
this will recommence training at epoch 1000 using a checkpoint in
<existing output name>, provided it exists. Note that you can just start from
the last checkpoint in the output directory by specifying -r -1 which uses
the standard python syntax for indexing the final element.
Once the training has finished we can generate a report with some plots
which are generated from our trained model. examples/runcards/report.yml
acts as the driving runcard for the analysis, the main thing here is to check
that training_output is the relative path to your trained model output.
For now, let’s continue with the model output called train. If you ran
the training example in examples/runcards then the report runcard is already
pointing at the correct location.
You might have noticed there is also a report.md file in examples/runcards.
This acts as the report template, and is written largely in standard markdown.
The reportengine specific syntax is {@<action>@} which allows you to place
“actions” into the report. Typically these actions will be plots or tables,
most of which can be found in:
Note
For more detailed discussion on reportengine reports, see
https://data.nnpdf.science/validphys-docs/guide.html#reports, although
note the actions discussed in that documentation relate to a different
reportengine project.
In the driving runcard for the report, you will notice there are other parameters which control how the model is sampled, feel free to experiment with these. In order to generate the report, in the same directory as the report runcard:
$ anvil-sample report.yml
you should see some indication that the analysis code is running, once it
has finished you can find the report in output/index.html. As with the
training you can change the name of the output file with --output. To
see the full range of options when running reports run:
$ anvil-sample --help
You can also use that command to find out about specific actions, or modules
which are part of anvil-sample, this is explained by the output of the
help.
anvil as a library
We supply some basic machinery to build your own normalising flow models. The relevant modules for this purpose are
anvil.neural_network: Generic neural networks.
anvil.layers: a collection of transformation layer classes
anvil.geometry: classes which transform the output of the transformations into meaningful geometries. These dictate which sites in your lattice get alternated between active and passive partitions.
anvil.distributions: a collection of distributions which can be used as base distributions (for latent variables) or target distributions.
For an example of how to incorporate these objects into an external project,
see examples/train_example.py. You can run the example script:
$ ./train_example.py
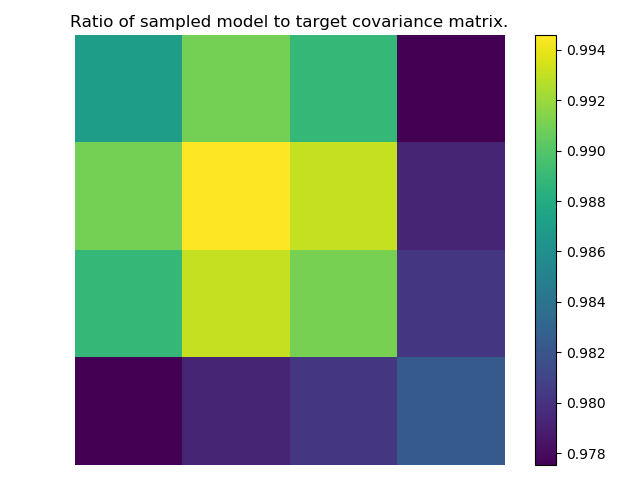
Which should produce some example plots in examples/example_output,
for example: